 DataTube2 User Guide
This site gives you the initial and necessary information to run DataTube2, a visual mining application devoted to temporal data.
Outils pour utilisateurs
visualization_settings
Visualization settings
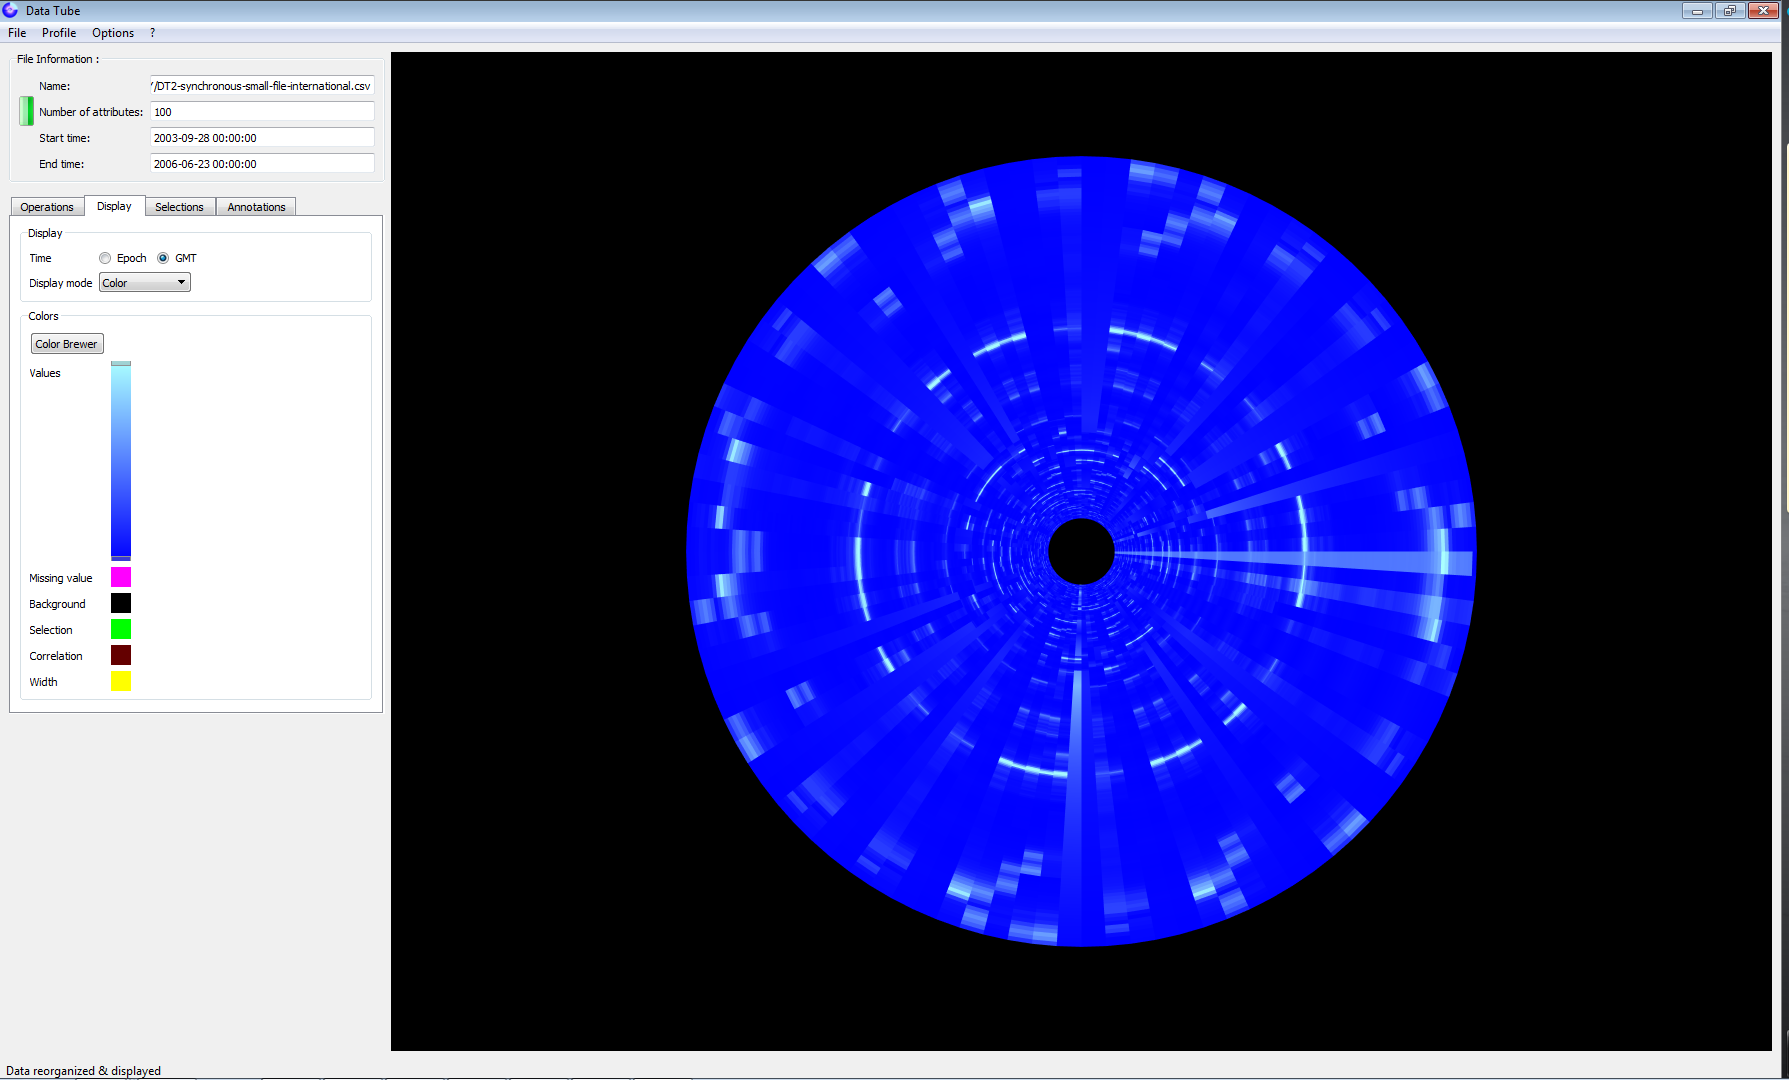
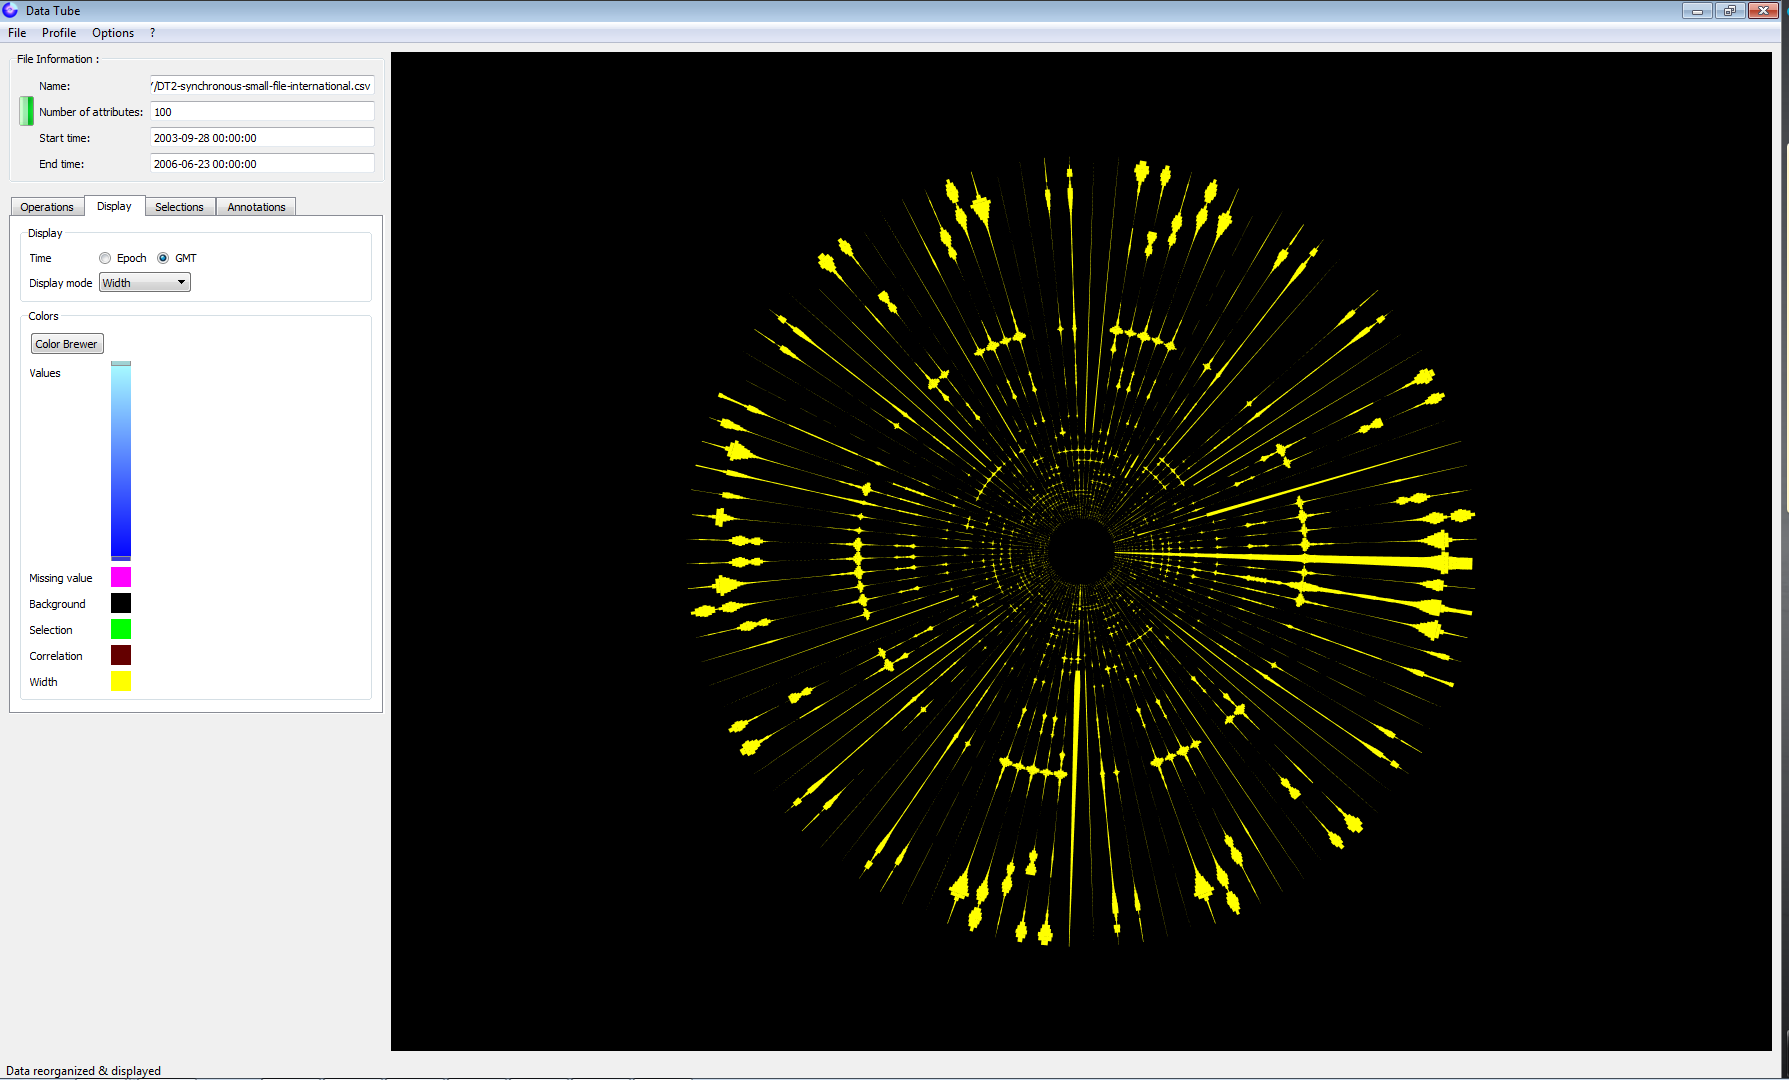
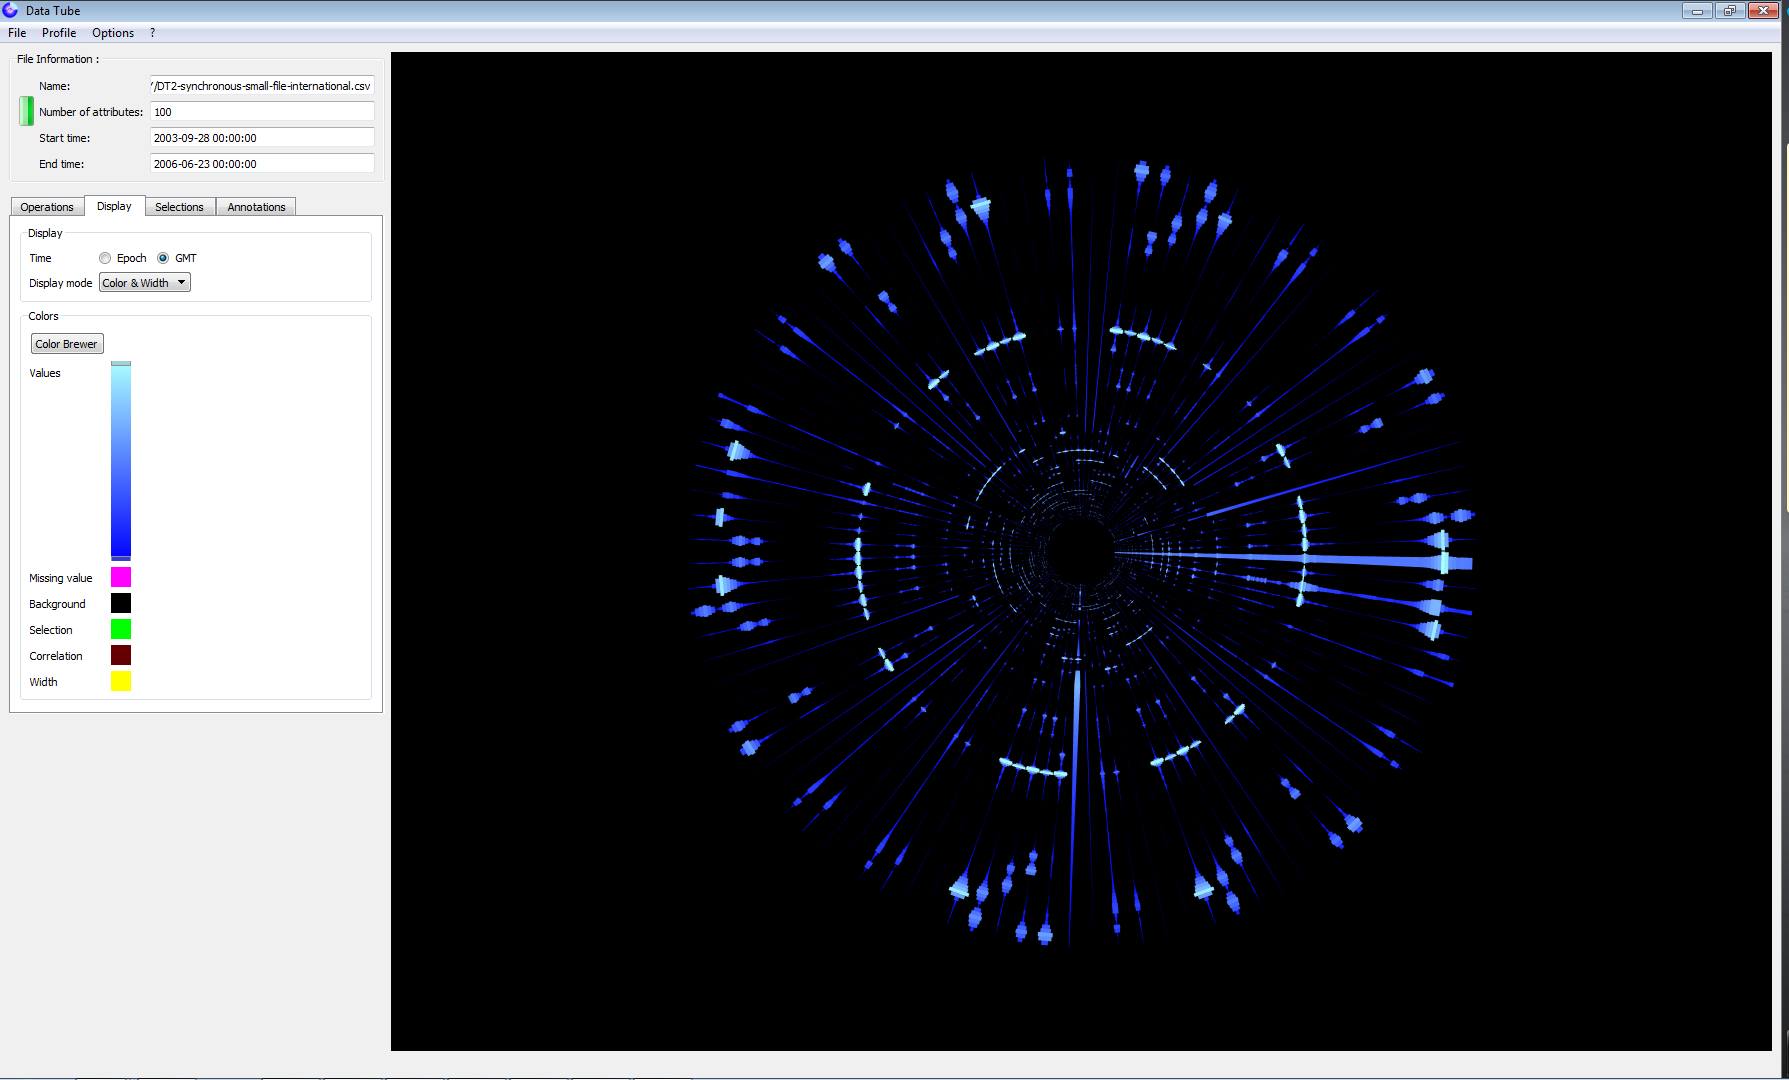
Three visualization modes can be used:
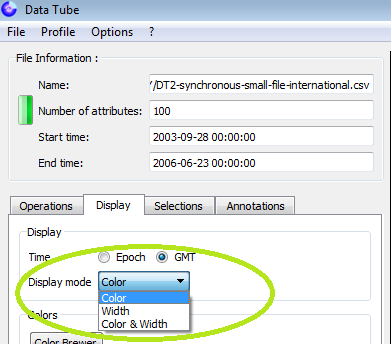
They correspond to color, width or color + width modes:
Colors can be edited as follows:
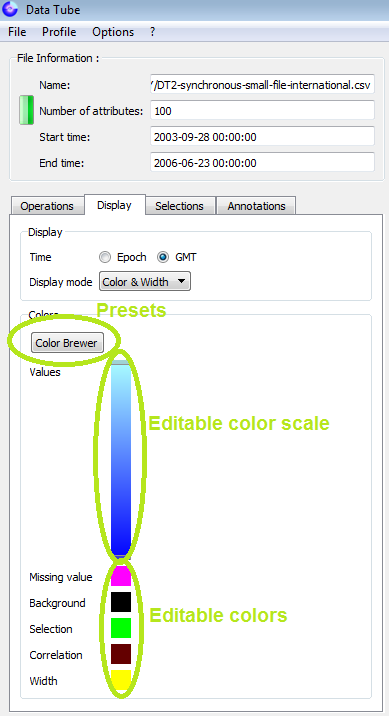
Preset inspired by Color Brewer 2 can be used.
You can edit the color scale:
- you can move the cursors of each color level,
- with a right click, delete a color level,
- with a double click, add a new level.
The other colors can be edited (left click on them).
visualization_settings.txt · Dernière modification: 2015/02/23 16:32 par venturini
Outils de la page
Sauf mention contraire, le contenu de ce wiki est placé sous les termes de la licence suivante : GNU Free Documentation License 1.3
